
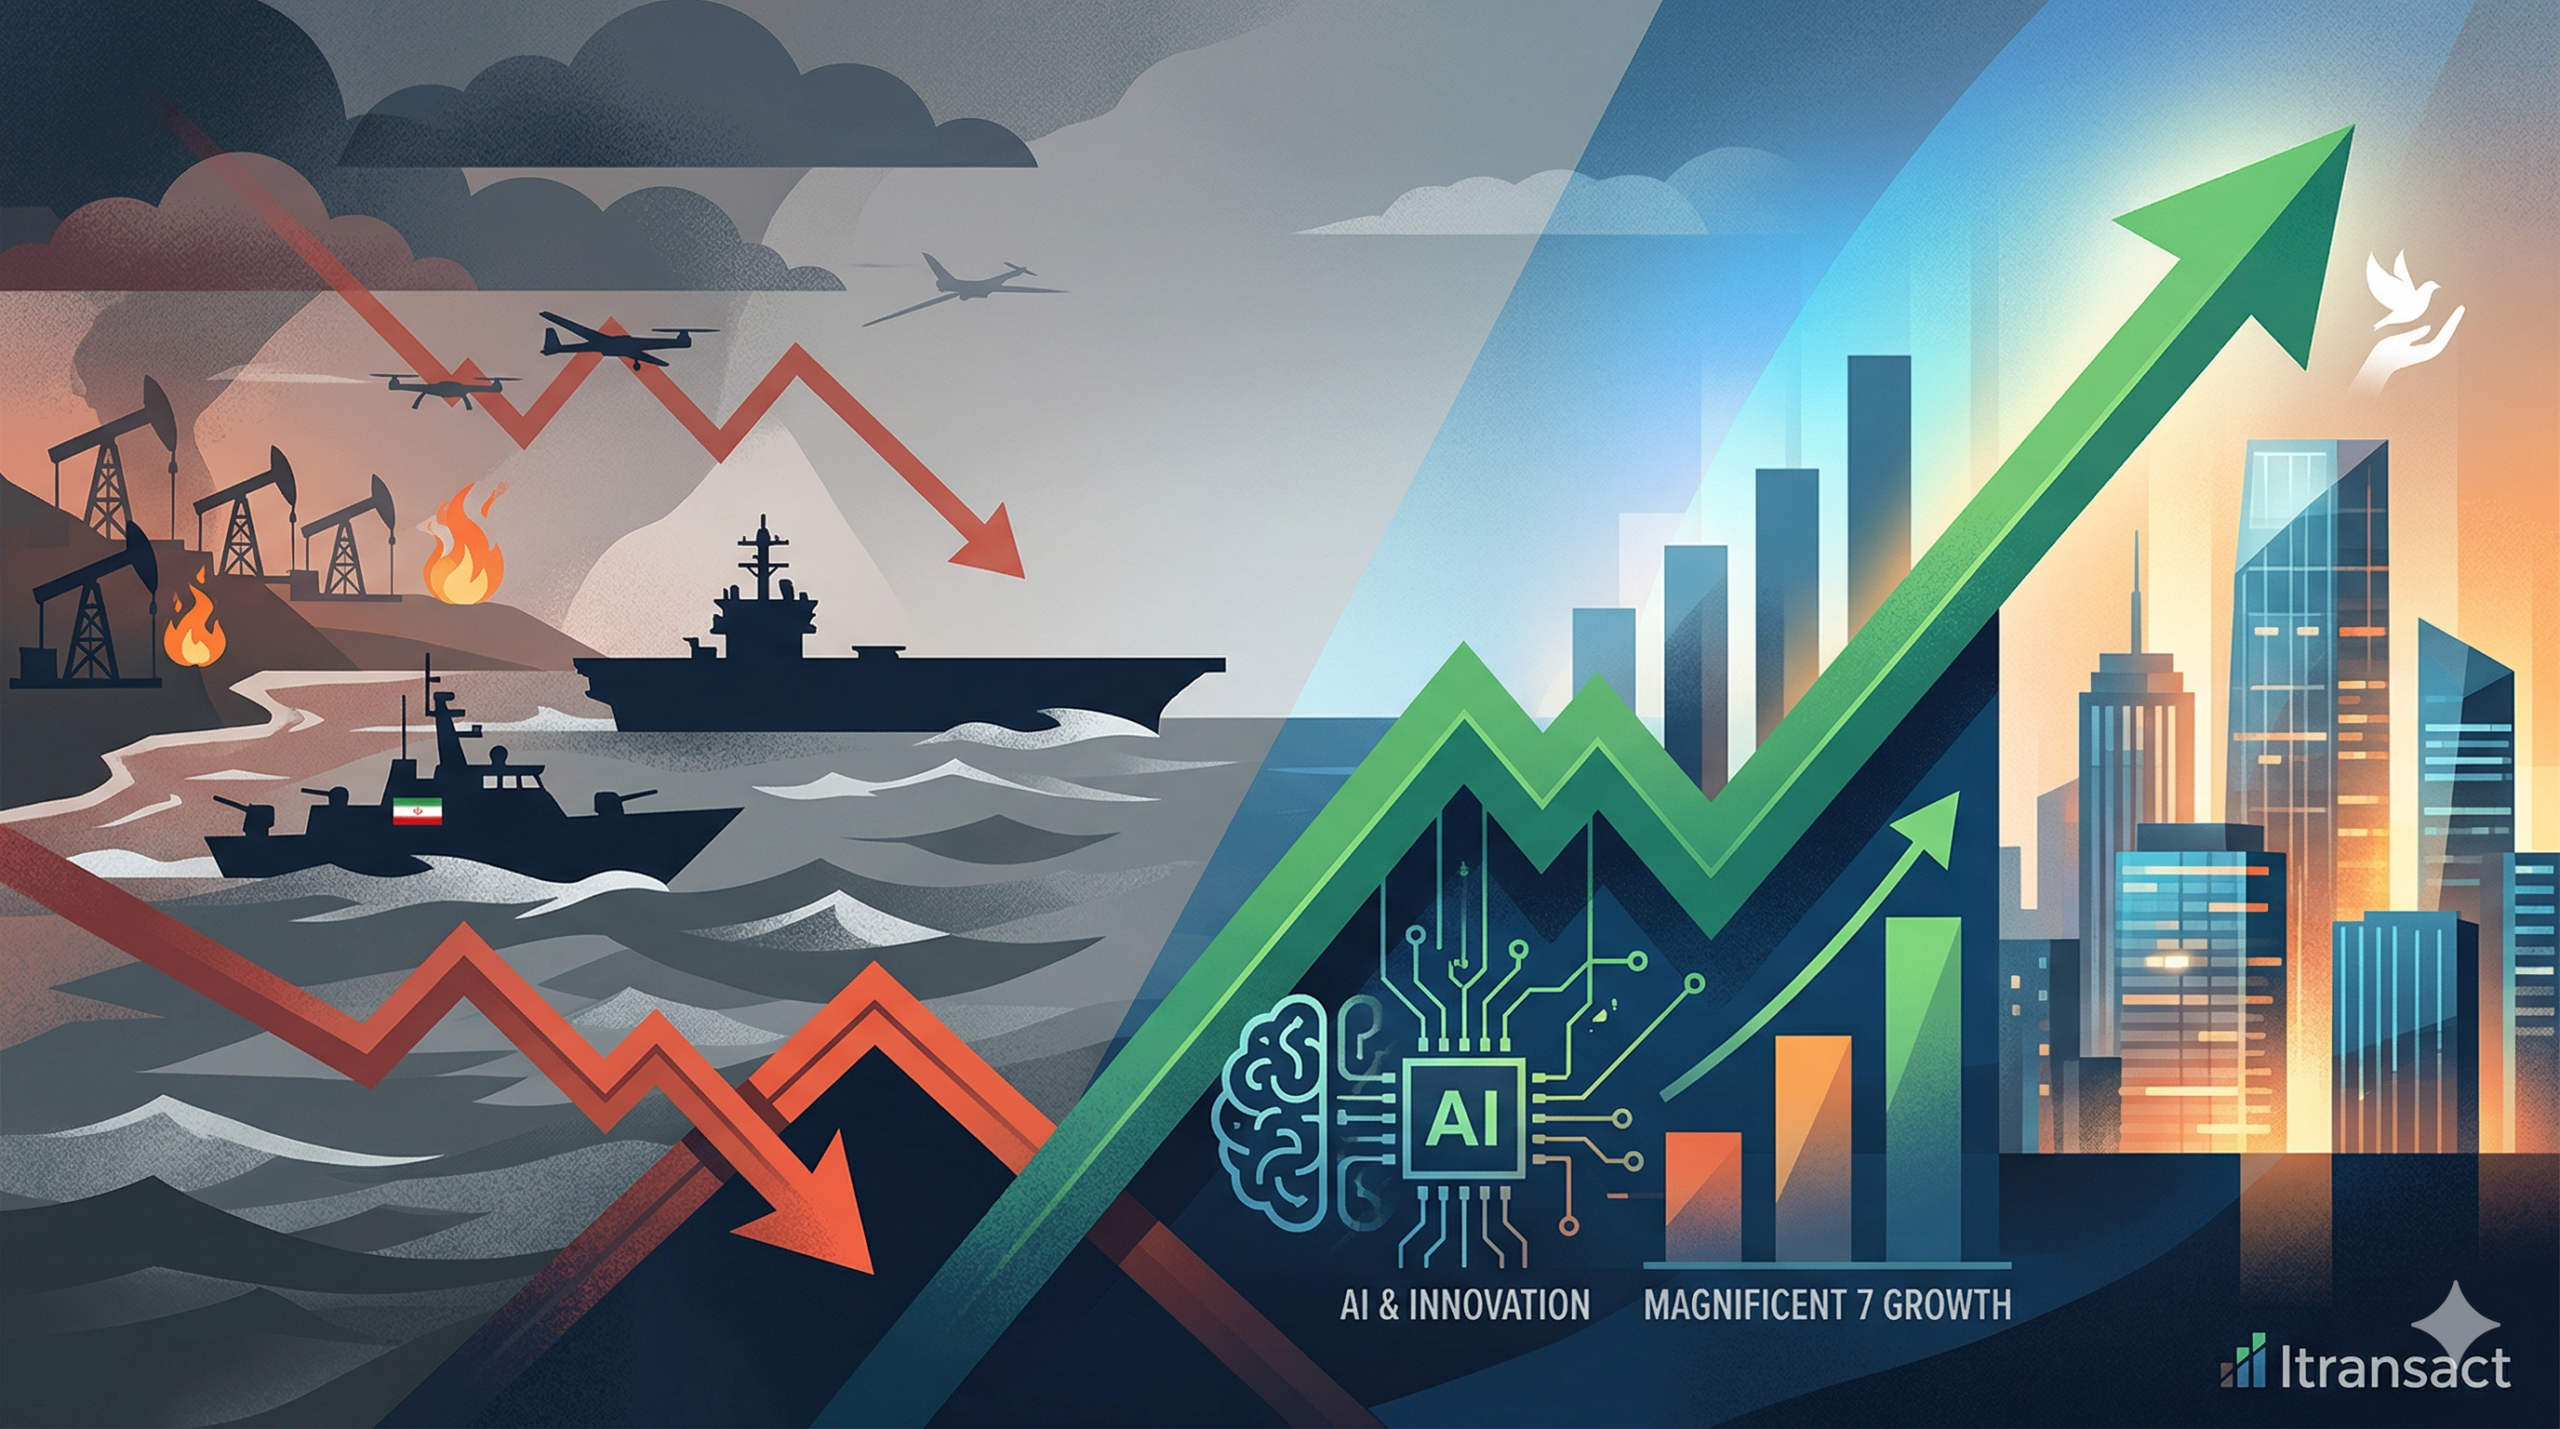
Navigating Geopolitical Uncertainty and the Case for Staying Invested
Executive Summary: The Resilience of Markets
As we navigate the current escalation of the Iran–U.S. conflict in early 2026—marked by the closure of the Strait of Hormuz and the recent assassination of the Iranian Supreme Leader—we provide this historical and data-driven perspective to guide your investment strategy.
The primary question facing investors today is whether to retreat to cash or maintain their positions. While the current conflict is significant, history consistently demonstrates that geopolitical shocks are typically short-term events that do not derail long-term market trajectories. Our stance remains firm: Stay invested. The cost of missing the inevitable recovery far outweighs the temporary pain of volatility.
1. The “War Puzzle”: Why Markets Bottom Before Peace
In the study The War Puzzle (Brune, Hens, Rieger, and Wang), researchers identified a counterintuitive phenomenon:
“In cases when there is a pre-war phase, an increase in the war likelihood tends to decrease stock prices, but the ultimate outbreak of a war increases them.”
The current Iran–U.S. conflict falls into a complex category. While the buildup of aircraft carriers provided a “pre-war phase,” the start was punctuated by the “surprise” assassination and subsequent closure of the Strait of Hormuz. Historically, “surprise” starts trigger sharp drawdowns, but these are precisely the moments where the “War Puzzle” suggests the market begins to price in the worst-case scenario, often leading to a recovery long before the conflict actually ends.
2. Recent Lessons: COVID-19 and Russia-Ukraine
- COVID-19 (2020): An “invisible war” that saw a -33.9% drawdown in just 33 days. However, the recovery was equally swift as central banks intervened, proving that even global existential threats are met with market resilience.
- Russia-Ukraine & Inflation (2022): This period combined a physical invasion with the “Inflation + Fed Hikes” cycle (Jan 2022 – Oct 2022). Many investors panic-sold during this year, citing the energy crisis and the Nord Stream 2 failure. They likely regretted it.
3. The Control Indicator: The AI Bull Market (2022–2025)
The most compelling evidence for staying invested is the period that immediately followed the 2022 gloom. Driven by the “Magnificent 7” and a surge in AI capital spending, the market entered a historic rally that truly outpaced any losses from the Ukraine war and the inflation/Fed hike period combined. Certainly a loss for those who sold in panic. Here are the key numbers:
- 2023 Returns: 24.2%
- 2024 Returns: 23.3%
- Cumulative Performance (Oct 2022 – Late 2025): 100.6% (a doubling of wealth)
Investors who “waited for the situation to stabilize” in early 2022 missed a literal doubling of their capital. This rally far outpaced the losses during the Ukraine war and the inflation/Fed hike period combined.
4. Updated Historical Data Tables
Table 1: Geopolitical Events and Stock Market Reactions
Historical drawdowns and recovery durations.
| Event | Bottom Date | S&P 500 Drawdown | Days to Bottom | Days to Recovery |
|---|---|---|---|---|
| Pearl Harbor (1941) | Dec 1941 | -19.8% | 143 | 307 |
| Cuban Missile Crisis (1962) | Oct 1962 | -6.6% | 8 | 18 |
| Iraq Invasion of Kuwait (1990) | Oct 1990 | -16.9% | 71 | 189 |
| 9/11 Terrorist Attacks (2001) | Sept 2001 | -11.6% | 11 | 31 |
| COVID-19 Pandemic (2020) | Mar 2020 | -33.9% | 33 | 148 |
| Russia-Ukraine/Inflation (2022) | Oct 2022 | -25.4% | 282 | 450 |
| Bull Market Recovery (Control) | N/A | +100.6% (Gain) | N/A | N/A |
Table 2: Capital Market Performance During Times of War
Returns during the duration of major conflicts.
| War/Conflict Period | S&P 500 Performance | Context/Economic Drivers |
|---|---|---|
| WWII (1939–1945) | +16.9% (Annualized) | Massive industrial mobilization. |
| Korean War (1950–1953) | +18.7% (Annualized) | Post-war consumer boom. |
| Vietnam War (1964–1973) | +6.4% (Annualized) | Stagflation and social unrest. |
| Gulf War (1990–1991) | +11.7% (Annualized) | Swift resolution; energy stability. |
| Russia-Ukraine (2022-2023) | -8.2% (1-Year Total) | Impact of Fed rate hikes/inflation. |
| AI Bull Market (2022-2025) | +100.6% (Cumulative) | Secular growth in Tech & AI. |
5. Portfolio history and performance
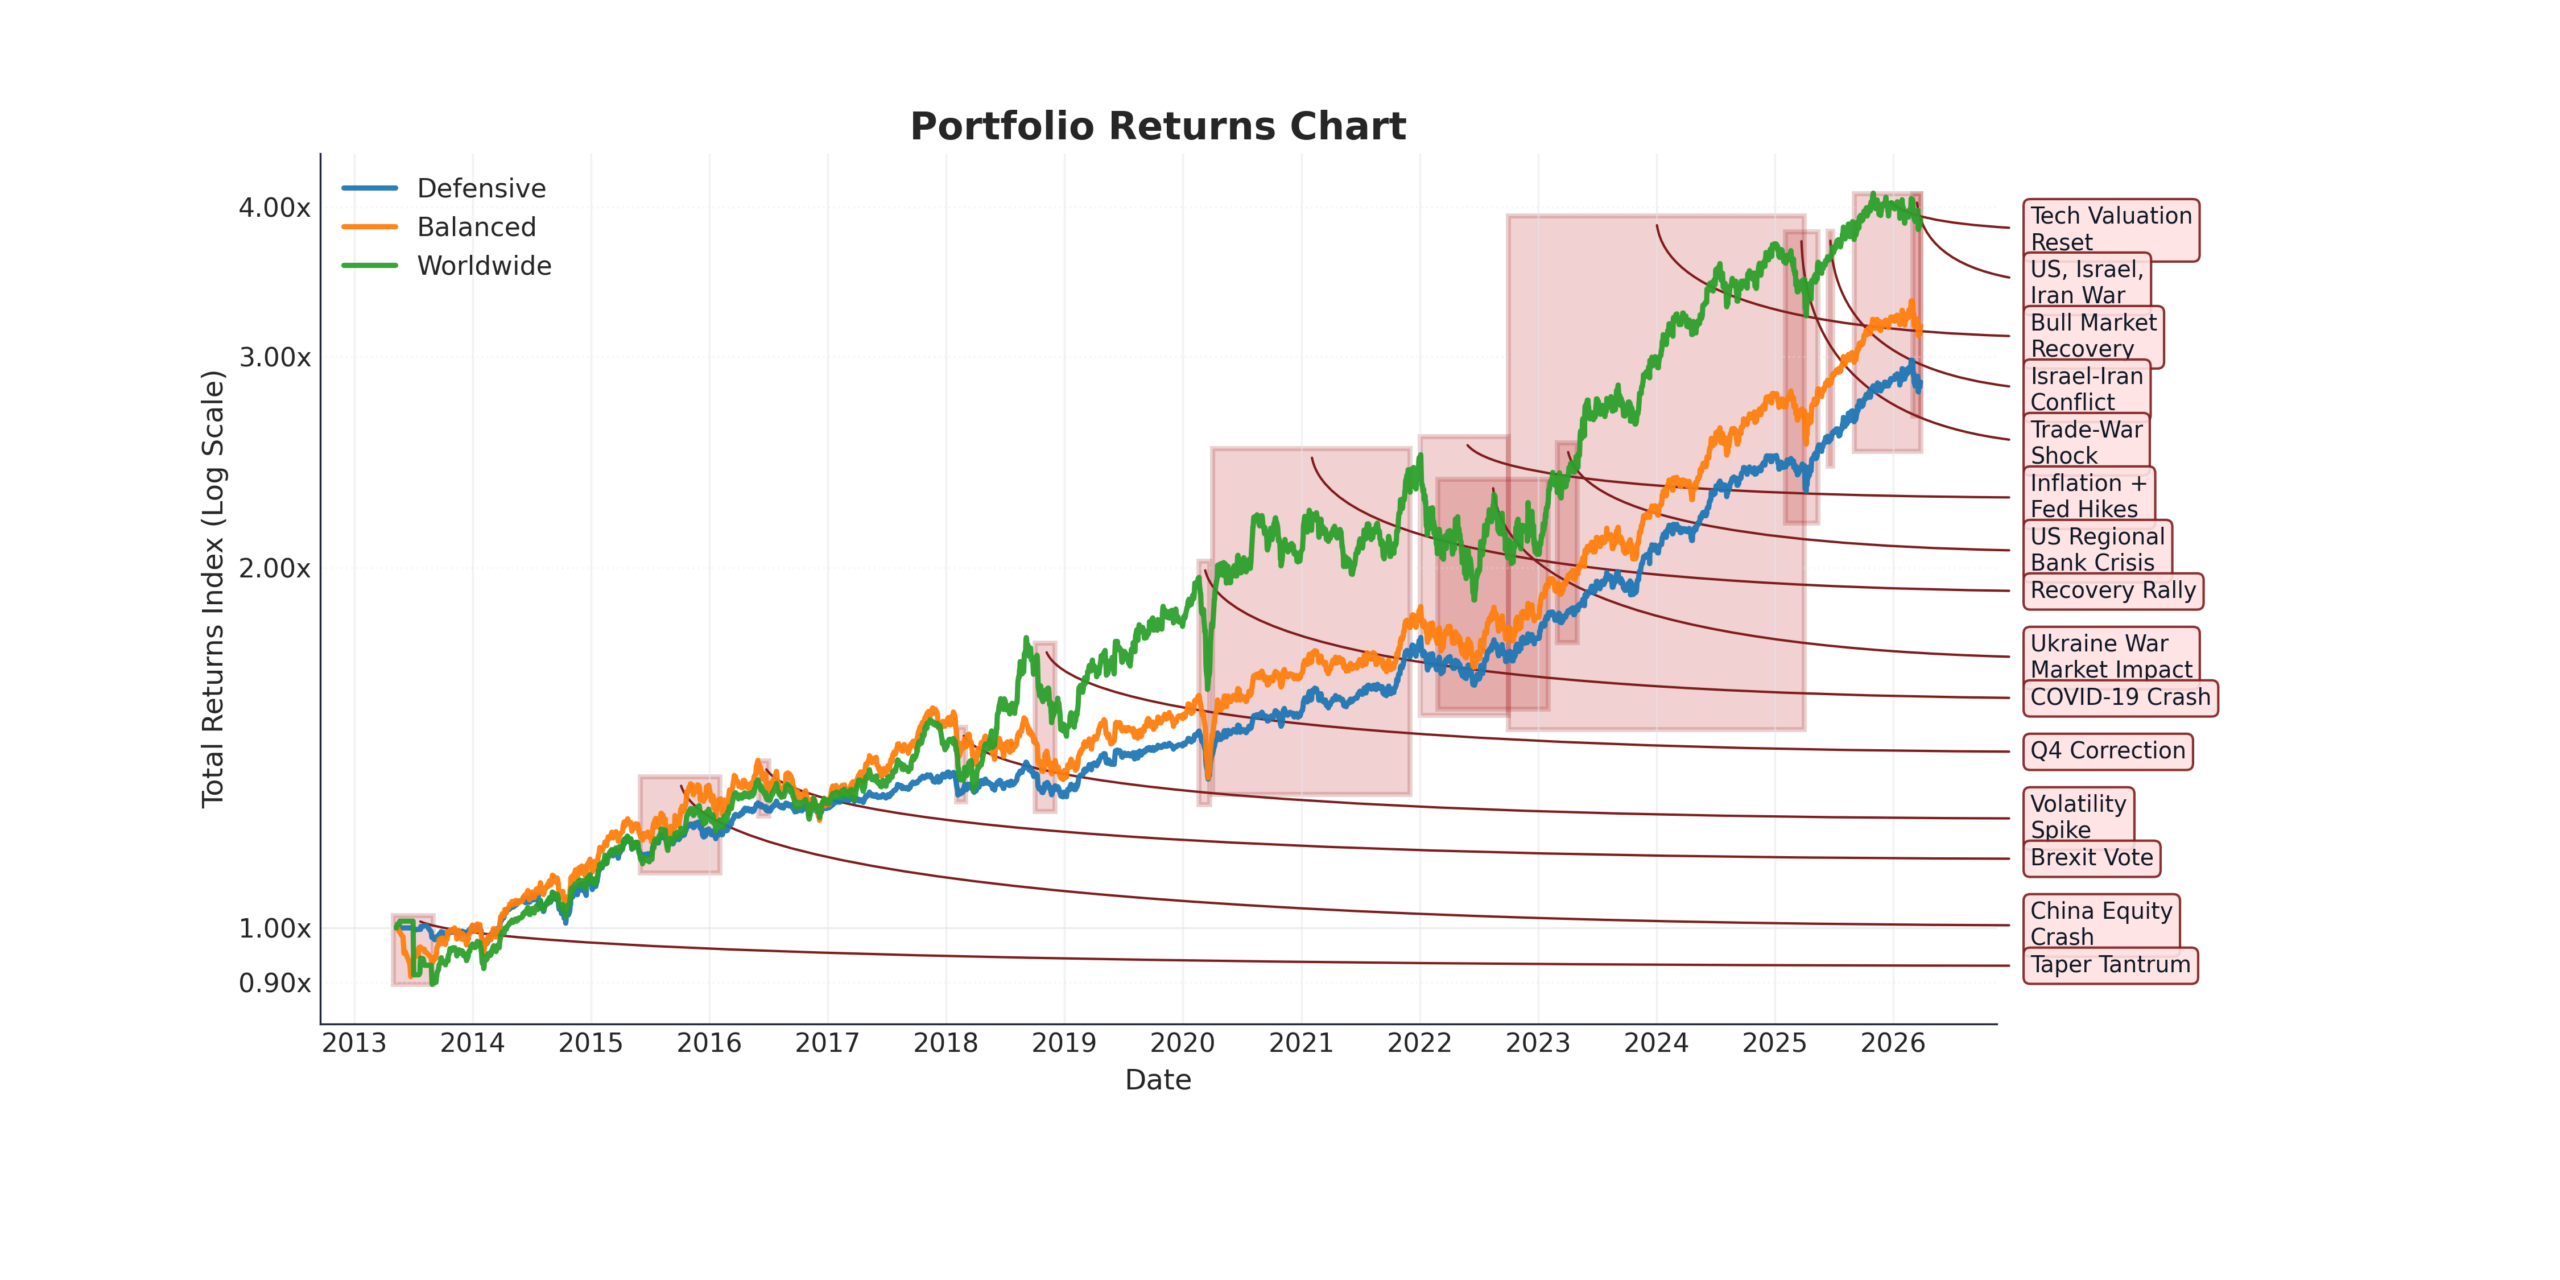
With the chart below, we can see the performance of the portfolios during the period of the Ukraine war and the subsequent recovery. We see that the portfolios that stayed invested during the Ukraine war and the inflation + Fed hikes period significantly outperformed those that disinvested. The portfolios that disinvested in early 2022 to avoid the impact of the Ukraine war would have missed out on the significant rally that followed, which far outpaced any losses during the Ukraine war and the inflation + Fed hikes period combined.
Strategic Outlook and Conclusion
The current Iran–U.S. war is a serious event that will likely cause headline volatility and energy price fluctuations. However, the closure of the Strait of Hormuz is a “known unknown”—the market is already adjusting to this reality.
If we look at the 100.6% gain achieved between late 2022 and late 2025, we see that it occurred despite an ongoing war in Europe and the beginning of intense trade wars in early 2025. The engine of the global economy—innovation and corporate earnings—is more powerful than the temporary disruption of conflict.
Our Recommendation: We advise investors to ignore the “sound of the cannons” and focus on the long-term compounding of the global economy. Our managed ETF portfolios remain strategically positioned to capture the recovery that history tells us is inevitable.
